
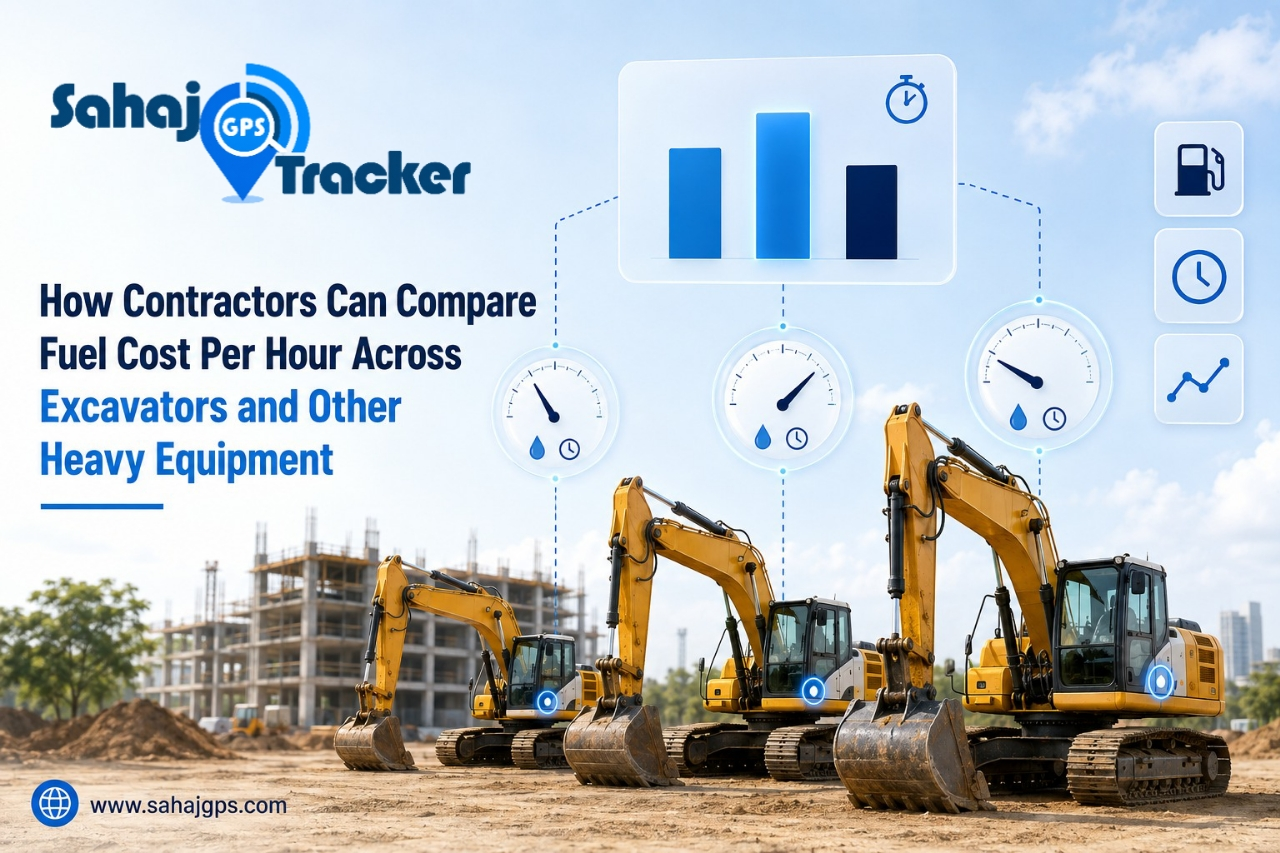
Two excavators on the same site can burn very different amounts of diesel. A fuel monitoring system shows you which one, and helps you find out why.
A contractor has three excavators working on one project. At the end of the month, the diesel bill is higher than planned. So which machine is the problem?
The slips say Excavator 2 took the most fuel. But Excavator 2 also worked the most hours. Is it thirsty, or just busy? Nobody can say for sure. The team argues, the site engineer shrugs, and the bill gets paid.
This is where fuel cost per hour helps. It’s a simple number, and it turns a vague worry into something you can compare.
What Does “Fuel Cost Per Hour” Actually Mean?
It’s the diesel a machine uses in one hour of running, multiplied by what you paid per litre.
Litres used ÷ engine hours = litres per hour
Litres per hour × price per litre = fuel cost per hour
Here’s a quick example. These numbers are made up to show the maths, so use your own.
- Excavator A used 600 litres over 40 hours. That’s 15 litres an hour.
- Excavator B used 540 litres over 30 hours. That’s 18 litres an hour.
- At ₹90 a litre, A costs ₹1,350 an hour and B costs ₹1,620.
B used less diesel in total, so on the monthly slip it looked fine. But it burns three litres more every hour it runs. That’s an extra ₹270 per hour. Over 100 hours, that’s ₹27,000 you’d never spot from the total alone.
Why Comparing Machines Is Harder Than It Looks
If it were as simple as dividing two numbers, every contractor would do it. The trouble is that the numbers hide a lot.
Machines are different. A bigger engine burns more. A newer machine may burn less than an older one doing the same job.
The work is different. Digging hard soil, loading trucks, travelling across the site and just standing still all use different amounts of fuel.
Idling changes everything. Engine hours include time the machine spends running but doing nothing. A machine that idles a lot can show a low litres-per-hour figure and still be wasting money, because it’s burning diesel without moving any earth.
Operators differ. The same machine can burn noticeably different amounts of fuel in different hands.
So a low number isn’t automatically good, and a high one isn’t automatically bad. You need context.
Five Rules for a Fair Comparison
- Compare like with like. An excavator against an excavator of similar size, not against a loader or a roller.
- Compare similar work. If one machine is breaking rock and another is moving loose soil, the numbers won’t line up.
- Use a long enough period. A full week or a month, not one odd shift.
- Separate working hours from idle hours. Look at both numbers, not just one.
- Use measured data, not guesses. Estimated or rounded figures are where most comparisons go wrong.
What Data You Need
You need five things for each machine:
- Engine hours (from the hour meter or tracking records)
- Fuel actually used
- Every refill: when it happened and how much went in
- Idle time
- The price you paid per litre
Getting the first four right is the hard part, which brings us to the real problem.
Where the Numbers Usually Come From (and Where They Go Wrong)
On many sites, fuel data still comes from diesel issue slips and a register. Someone notes the litres, someone else notes the hour-meter reading, and at month end somebody tries to match them.
That works until it doesn’t. Machines get refuelled from a shared bowser. Slips don’t match the actual fill. Hour readings are noted late or rounded. And when the figures don’t add up, it’s very hard to tell whether the cause is a mistake, waste or something worse.
A fuel sensor in the tank changes this. It reads the fuel level continuously, so every fill and every drop is recorded with a time, instead of being worked out later. That’s the idea behind fuel consumption tracking: you see how much each machine actually used, not how much someone wrote down.
This matters even more on remote sites, where nobody is watching the tank. We looked at how a mining operation approached the same problem in this case study on cutting fuel costs with GPS monitoring.
A Simple Comparison Table You Can Build This Week
Take one month of data for similar machines and lay it out like this. (Again, example figures.)
| Machine | Engine hours | Fuel used (litres) | Litres per hour | Idle share | Fuel cost per hour (at ₹90) |
| Excavator A | 40 | 600 | 15 | 20% | ₹1,350 |
| Excavator B | 30 | 540 | 18 | 12% | ₹1,620 |
| Excavator C | 35 | 490 | 14 | 35% | ₹1,260 |
Look at what the table says. Excavator C has the lowest cost per hour, which looks great. But it spent 35% of its time idling. It isn’t efficient, it just isn’t working much. Excavator B has the highest cost per hour but the least idle time, so the first question there is why it’s burning more while it works.
Same data, three different stories. That’s why you read the columns together.
What to Do When a Number Looks Off
When one machine stands out, don’t jump to conclusions. Go through it in order:
- Check the idle share. Is the machine sitting with the engine on?
- Compare it with machines doing similar work. Is its job actually heavier?
- Compare refills against what was recorded. Do the fills match the slips?
- Look for sudden drops in the fuel level, especially when the machine isn’t working. Sudden drops are different from normal burning, and we’ve written about the warning signs in fuel theft detection.
- Ask about maintenance. Clogged filters, worn injectors and neglected servicing can all push fuel use up.
- Talk to the operator. The explanation is often simple.
Most of the time, the answer shows up in the first three steps.
How to Bring Fuel Cost Per Hour Down
Once you know which machines cost more, you can do something about it.
- Cut idling. Set a simple rule to switch off the engine during long waits. Tracking tools built for construction fleets can show idle time and long stoppages, so you know where the waiting happens.
- Match the machine to the job. A larger machine on light work burns diesel for no reason.
- Share the data with operators. Many don’t realise how much time they idle until someone shows them the numbers. Recognise improvement when you see it.
- Service on time. A machine in good shape uses less fuel for the same work.
- Plan the site better. Less repositioning and fewer delays mean fewer wasted hours. We’ve covered other ways in how GPS tracking improves efficiency on construction sites.
How SAHAJ GPS Helps
SAHAJ GPS Fuel Monitoring System combines GPS tracking with fuel sensors installed in the tank. For contractors comparing equipment, a few parts matter most:
- Real-time fuel level monitoring, so every change in the tank is recorded
- Fill and drain alerts, with the exact amount and the time
- Consumption reports that show fuel use over time
- Work Hour vs. Fuel Mileage report, which compares fuel use against the working hours of your vehicles
- Fuel Expense Summary, for an overview of fuel costs across your fleet
- Support for multiple fuel sensors, useful on large or dual tanks
It works with construction vehicles as well as trucks, buses and vans. One practical point: it needs a compatible GPS tracker and good-quality fuel sensors fitted to the machine. It isn’t software alone.
Frequently Asked Questions
What is fuel cost per hour?
It’s how much fuel a machine uses in one hour of running, multiplied by the price per litre. It helps you compare machines on a common basis.
How do I calculate fuel cost per hour for an excavator?
Divide the litres used by the engine hours to get litres per hour, then multiply by your price per litre.
Is a lower fuel cost per hour always better?
No. A low number can mean a machine is efficient, or it can mean it spends much of its time idling. Look at idle time alongside it.
Can I compare an excavator with a loader or a dozer?
Not directly. Different machines do different work. Compare machines of the same type and size, or compare fuel against the work done.
Do I need special equipment to measure fuel use accurately?
For reliable figures, yes. You need fuel sensors in the tank and a compatible GPS tracker, so that every fill and drop is recorded automatically.
Final Thoughts
Your monthly diesel total tells you that something is costing money. Fuel cost per hour tells you which machine, and with the right data, why.
If you’d like to see how fuel data looks for your own equipment, talk to the SAHAJ GPS team for a demo, or take a look at SAHAJ GPS fuel monitoring.