
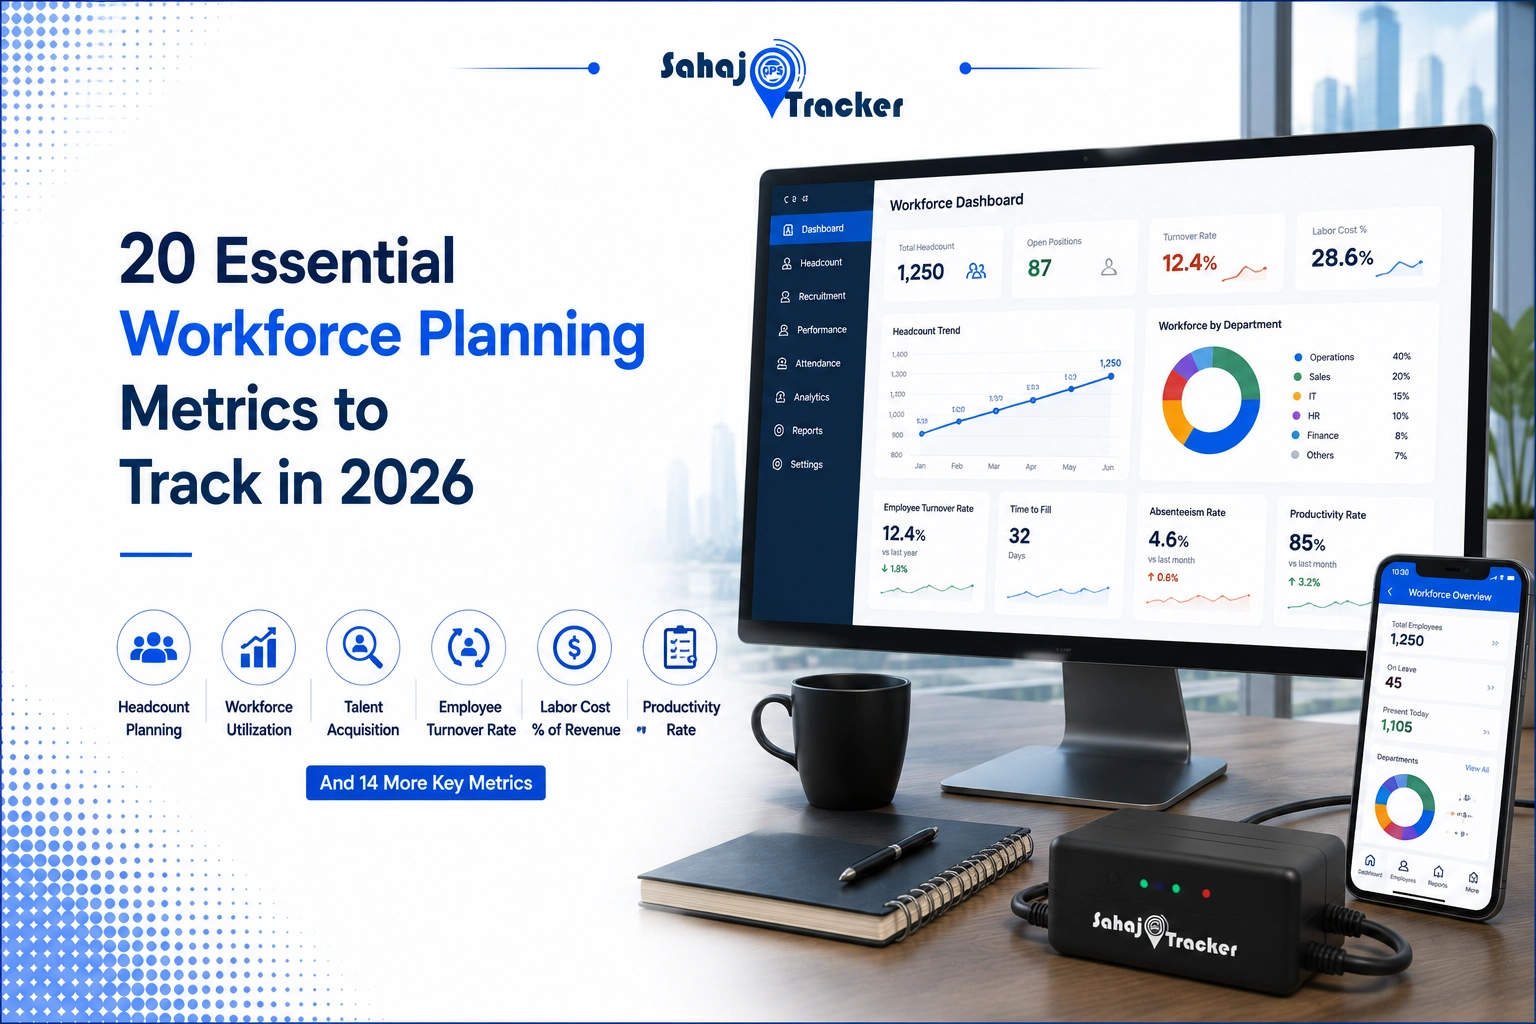
Honestly, most companies track way too much data and still somehow have no clue what’s actually happening with their field teams day to day. Weird, right? You’d think more numbers means more clarity, but it usually just means more noise.
If you’re heading into 2026 workforce planning without a clear sense of which metrics genuinely matter, you’re basically flying blind with a very expensive dashboard sitting unused somewhere. Employee expense management alone, if tracked properly, tells you more about operational health than half the vanity metrics companies obsess over.
I’ve sat through enough workforce planning meetings to notice a pattern – teams either drown in irrelevant data or track almost nothing meaningful at all. Rarely a healthy middle ground. So let’s fix that, one metric at a time.
Attendance and Time-Based Metrics
These sound basic, sure, but you’d be surprised how many companies get even this wrong.
1. Attendance Accuracy Rate – not just whether someone showed up, but whether their logged time matches actual verified presence.
2. Average Check-In to Check-Out Duration – flags unusually short or suspiciously long visit durations worth investigating.
3. Late Arrivals and Early Departures – patterns here often predict bigger engagement issues down the line, not just punctuality problems.
4. Overtime Hours Logged – genuinely useful for budgeting, and honestly, chronic overtime usually signals understaffing rather than dedication.
Field Operations Metrics
This is where things get genuinely interesting for companies managing distributed teams.
5. Visit Completion Rate – scheduled versus actually completed field visits, a number that exposes a lot once you actually look at it.
6. Route Efficiency Score – how optimized daily travel actually is compared to ideal routing.
7. Time Spent Per Client Site – helps identify whether visits are rushed, thorough, or somewhere concerning in between.
8. Geofence Compliance Rate – the percentage of check-ins genuinely occurring within designated client zones, not just “somewhere nearby.”
Proof of Service Metrics for Field Operations
This category deserves special attention because it’s frequently overlooked entirely.
9. Digital Signature Capture Rate – how consistently field teams collect verifiable proof of service for field operations, rather than relying on verbal confirmation alone.
10. Photo Evidence Compliance – for service industries specifically, timestamped photo proof genuinely reduces disputes with clients later.
11. Task Completion Verification – cross-referencing claimed task completion against actual geo-tagged evidence.
12. Service Delay Frequency – tracking how often scheduled services run late, and more importantly, why.
Custom Form Management for Field Teams
Data entry consistency matters more than people give it credit for.
13. Form Submission Compliance Rate – are field staff actually filling out required forms completely, or skipping fields under time pressure?
14. Data Accuracy Score – cross-checking submitted form data against other verified sources like GPS logs or timestamps.
15. Custom Form Turnaround Time – how quickly submitted forms actually reach decision-makers for action.
Good custom form management for field teams genuinely eliminates a huge chunk of the paperwork chaos that used to plague field operations, replacing messy handwritten reports with structured, trackable digital submissions.
Employee Expense Management Metrics
Money leaks quietly here more often than most managers realize.
16. Expense Claim Accuracy – flagging discrepancies between claimed travel distance and actual GPS-tracked distance.
17. Reimbursement Turnaround Time – slow reimbursements genuinely hurt morale more than companies expect.
18. Fuel and Travel Cost Per Employee – a number that reveals inefficiencies hiding in plain sight once tracked consistently.
Proper employee expense management, tied directly to actual location and travel data rather than self-reported claims, catches inflated mileage and questionable reimbursements before they quietly drain your budget month after month.
Productivity and Performance Metrics
Rounding this out with the numbers that tie everything together.
19. Tasks Completed Per Working Hour – a genuinely fair productivity measure when normalized against actual hours logged, not just raw output.
20. Employee Utilization Rate – how much of someone’s paid time actually converts into productive, verifiable work.
Why 2026 Makes This More Urgent Than Before
Workforce costs keep climbing, and honestly, companies can’t afford loose tracking anymore the way they maybe could a few years back. Remote and hybrid field operations have also grown more complex, with more distributed teams than ever needing genuine oversight rather than guesswork.
The Shift From Manual Tracking to Verified Data
Spreadsheets and verbal check-ins simply don’t cut it at this scale anymore. Companies increasingly need systems that automatically verify location, time, and task completion rather than trusting self-reported logs that, let’s be honest, aren’t always entirely accurate.
How Sahaj GPS Brings This Together in One Place
Tracking twenty different metrics across separate tools sounds exhausting, and honestly, it usually is. This is exactly where Sahaj GPS has built genuine value – combining live location data, geofencing, expense verification, and custom form submissions into a single unified dashboard rather than forcing managers to piece together numbers from five disconnected systems.
Sahaj GPS specifically strengthens the proof of service for field operations side of things too, giving businesses verifiable, timestamped evidence rather than relying purely on employee self-reporting. For companies juggling employee expense management alongside field visit accuracy, having this consolidated in one place genuinely saves hours of manual reconciliation every single week.
Making Metrics Actionable, Not Just Collected
Sahaj GPS also focuses on surfacing insights rather than just raw numbers – flagging unusual patterns automatically instead of leaving managers to dig through spreadsheets manually every month trying to spot anomalies themselves.
Where This Leaves You Heading Into 2026
Picking the right metrics matters more than tracking everything possible. Start with attendance accuracy, proof of service, and expense verification if you’re overwhelmed by where to begin – these three alone expose most operational blind spots companies genuinely struggle with. The rest can follow once these foundational numbers are solid and trustworthy.
FAQs
Q1. Which workforce planning metrics matter most for field teams specifically?
Attendance accuracy, geofence compliance, proof of service verification, and expense claim accuracy tend to expose the biggest operational gaps first, making them ideal starting points for most field-based businesses in 2026.
Q2. How does custom form management improve field team accuracy?
It replaces inconsistent paperwork with structured digital submissions, ensuring required fields get completed properly while making data cross-referencing against GPS and timestamp records significantly easier for managers.
Q3. Why is employee expense management important for workforce planning?
It prevents inflated mileage claims and questionable reimbursements by cross-checking expenses against actual verified travel data, ultimately protecting company budgets from quiet, ongoing financial leakage.
Q4. What counts as reliable proof of service for field operations?
Timestamped photos, digital signatures, geofenced check-ins, and verified task completion logs collectively provide credible proof, reducing client disputes and improving overall service accountability significantly.
Q5. How often should companies review these workforce planning metrics?
Monthly reviews work well for most metrics, though attendance and expense-related numbers benefit from weekly checks to catch discrepancies before they compound into larger, harder-to-fix problems.